Tackling confusion with spreadsheet tables
I think that I have this tendency that when I don't understand something, I try to turn it into a spreadsheet table. Such tables have been a tremendous help for me in tackling confusion and turning it into more clarity and control. So I thought I'll try to share a few real-life examples:
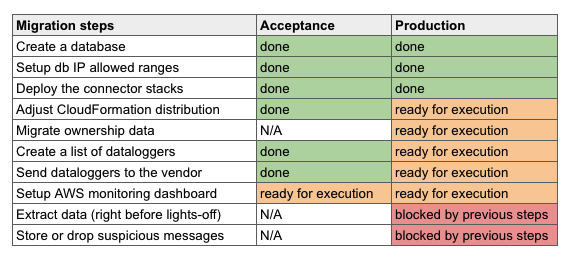
A checklist for system migration
An overview of who works on what

Status of a four-month project

Deciding things

Update: This idea can be taken further by voting
Coming up with a domain model

Tackling confusion about grid operator

I was also happy to find out that Simon Eskildsen touched upon this topic on his blog; where he describes how he started to force visuals into problems to gain perspective.
- ← Previous post: Taking care of people
- → Next post: More control with idempotency
This blog is written by Marcel Krcah, an independent consultant for product-oriented software engineering. If you like what you read, sign up for my newsletter